📊 So… what does good look like? Product benchmarks for dev tools in 2023

This article was originally published on Medium.
This year’s Product Benchmarks Report from OpenView is now out! Every year, OpenView publishes a report on the performance of product-led growth strategies. The report is based on responses to a survey of hundreds of company founders, and contains data such as conversion metrics, ARR growth, and lead sources across different companies. It’s always an interesting read, showing trends over the years and tips on successful strategies.
I was curious what the metrics for just dev tool companies looks like, and OpenView very kindly gave me access to a subset of this year’s raw data. Here are my findings.
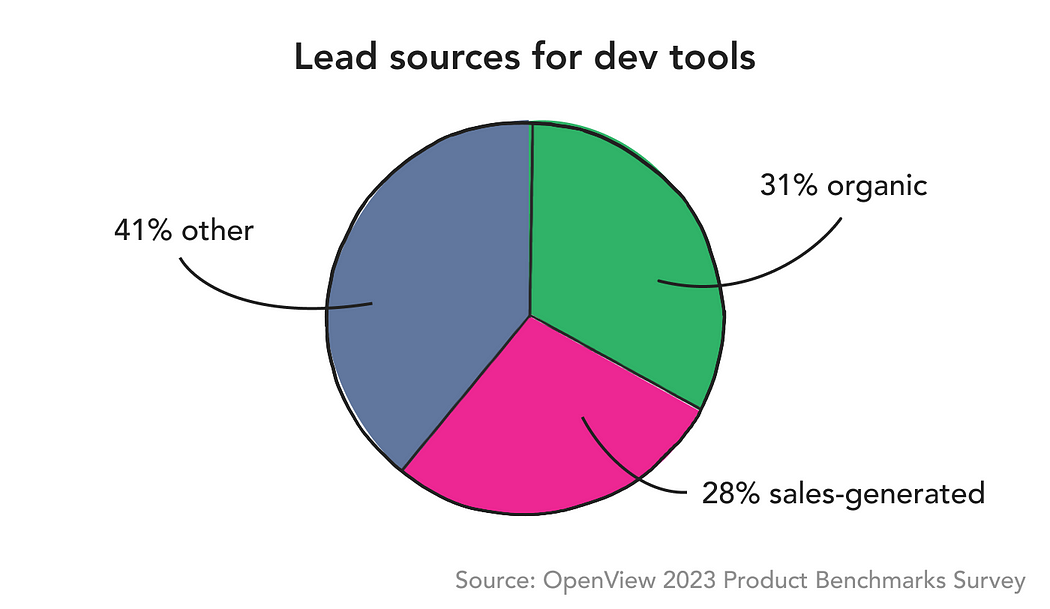
31% of leads are organic, and 28% are sales-generated
Before digging into some of the conversion metrics, I wanted to look at how teams in dev tool companies were getting their leads. Most of the leads they get are from organic sources (31%), with 28% generated by sales. OpenView notes that organic leads are declining compared to the previous year, with a greater shift towards sales-generated leads.
If we look specifically at the product-led growth companies, this dropped to 12% being generated by sales, and a larger proportion coming from organic (41%) and paid (25%) sources.
Still, even for sales-led orgs, organic leads made up a high percentage of their source (21%).
Higher growth companies (reporting 100% and above YoY growth) were more likely to have their leads come from organic sources. And although they took most of their revenue from sales-led activities, they took a slightly higher percentage of their ARR source from sales-assisted or self-serve activities compared to the whole cohort.
Having users invite or refer other users from within the product only drove 5% of product-driven leads. This rose to 9% for dev tools adopting a Freemium model. This is lower than the baseline across all SaaS companies, but this could be due to the nature of dev tools being typically used by a single team rather than a whole organisation, and having naturally less virality. That said, I believe that product-driven leads are often neglected in dev tool products. While it won’t make up a huge portion of your traffic, it will have an impact further down the funnel — you can drive this growth by making it easy for users to invite their team members to the tool, or incentivising them to refer their peers.
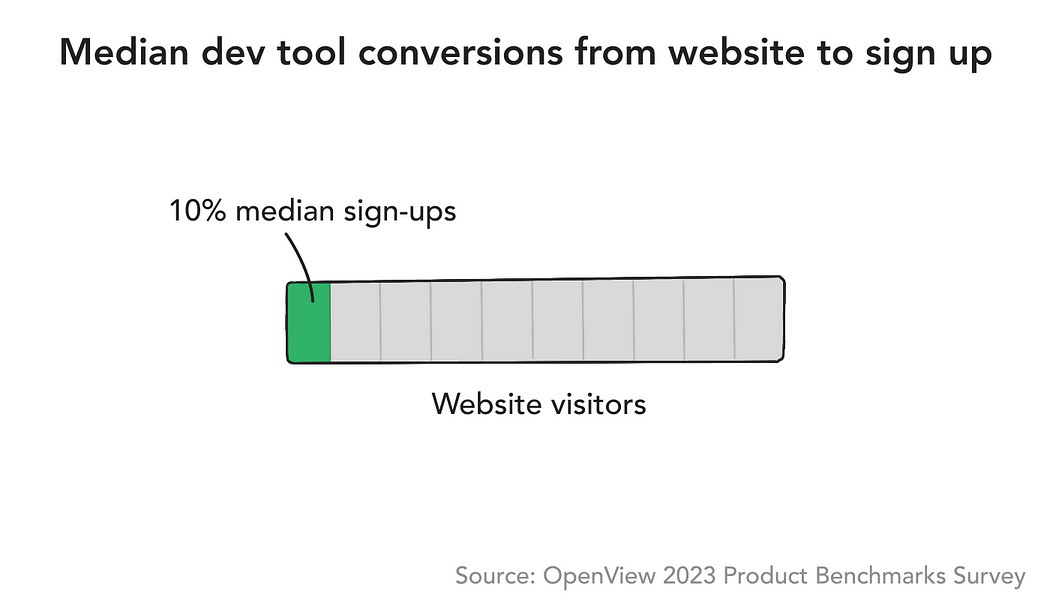
Median rate of conversion from visitors to users is 10%
Interestingly, OpenView’s data shows that the median conversion from website visitor to signup for developer tools is 10%. This number was a lot higher than I was expecting. I asked the OpenView team if I’d got something wrong, and they confirmed this year’s results were a bit higher than they’d expected too. Maybe companies are getting better at marketing!
Looking at the data, there are a few things that impact this conversion rate. Unsurprisingly, free trials and freemium products led to a higher percentage of sign ups compared to traditional sales led products. OpenView found the website to signup conversion rate for all surveyed companies to be 5% for products offering a free trial, and 9% for freemium. The overall distribution in results was high, from 2% for the 25th percentile for free trials, to 20% for the 75th percentile for freemium. Companies that have a growth team also saw higher rates of conversion.
Another thing mentioned in the report was that the average number of website visits prior to signing up is 3.3. Return visits might be a useful experience to optimise for.
Activation rates are unique to each product
Activation (also known as the “aha moment”) is the point at which the product first delivers the value it promised. This is an important point to measure, as it is a precursor to retention and eventually conversion to a paid plan.
B2B dev tools can be challenging to get PLG motions going as they often require an integration to be set up, which then may require approval from someone else in the company. Also, these products often require team collaboration, which means getting value buy-in from multiple users in a single account.
While OpenView collects metrics on activation rates in their survey, they point out that rates are unique to each product. This is why I haven’t given a specific benchmark. In their 2022 report, they give three examples:
Lenny Rachitsky lists out some more examples in his post with Yuriy Timen, and breaks these down into different market segments. He’s also offered some metrics for those that are looking for a benchmark.
While the percentage of users getting to the activation point varies across products, the likelihood of a user reaching it is most impacted by whether the product’s value is most effectively delivered in collaborative or single user use cases. Using the above examples, Loom and Zoom’s activation points require another user to participate. This makes the activation point harder to attain than Zapier’s, which only requires a single user to complete.
This isn’t to suggest that Loom and Zoom should change their activation points — they’ve chosen these ones specifically because they understand that the true value of their products is in collaboration with other users, so the activation point needs to include that.
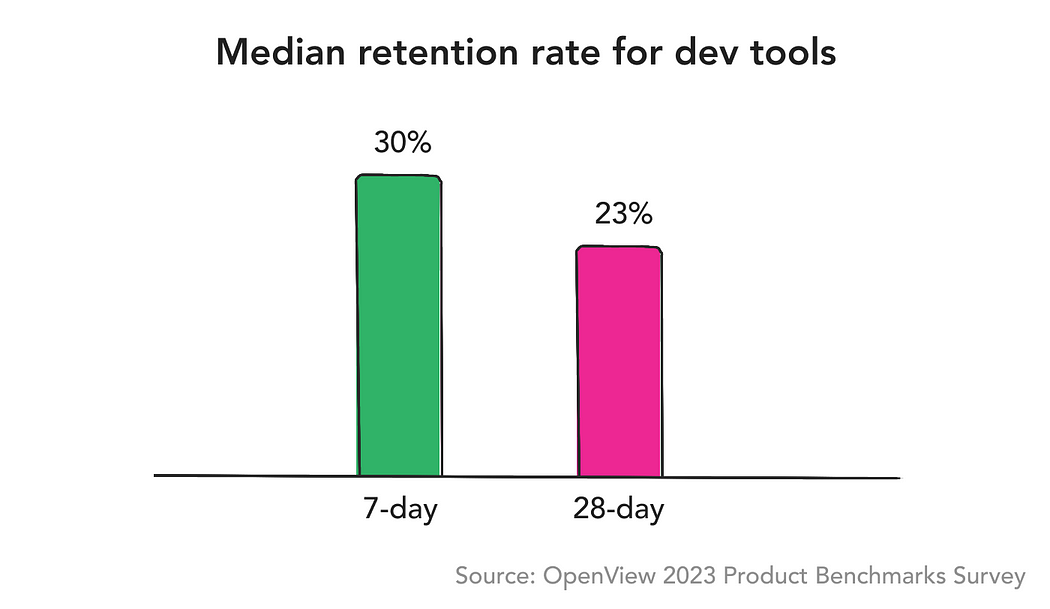
Median 28-day retention rate is 23%
Retention measures whether users continue using the product after they’ve signed up. Generally, if a user hasn’t come back after a month, they’re unlikely to come back at all. Some companies measure further into the future — 7, 30 and 90 day benchmarks are typical. Which metric to focus on depends on the level of activities users can perform in the product.
The median 7 day retention rate for dev tool companies is 30%, and 28 day retention is 23%.
Fluctuation in the data set was high. Some companies were really struggling, with single-digit retention after 7 days. Others reported very high retention — mostly from companies that rely on demos as their main starting method (as opposed to freemium or free trials). This is to be expected, given that users in this cohort will be hand-held through the process, but the drawback is that it’s expensive and doesn’t scale as well.
Retention is such an important benchmark for PLG businesses. Low retention means users are less likely to convert to a paid plan, which has a direct impact on revenue. I talk about some of the ways retention can be improved in my post Repair tips for leaky conversion funnels.
Median rate of conversion to a paid account is 5%
OpenView looked at the percentage of free new accounts convert to a paid account within 6 months of signing up, and found a stark contrast between products that do and don’t sell to developers. For those that don’t, the median came out at 10%. But if we look just at the companies that are selling to developers, that drops to 5%.
Another factor that impacted conversion was the size of the buyer, with larger companies having lower conversion rates. This could be explained by stricter procurement processes. The buying power that developers once had has shifted in recent years, so understanding how to sell the value of developer tools is now critical.
Taking these numbers all together, for a PLG dev tool company, we would expect that for every 100 visitors to the website, 10 would sign up, and of that 10, fewer than 1 will end up paying.

Supplementing their research with some data from Pendo, the report finds that 54% of conversions will happen in a user’s first 3 months, rising to 85% in the first year. They mention an effective way to impact this conversion is when sales reach out to over 50% of new signups, effectively doubling the rate of conversion compared to companies that don’t reach out at all. Take note — this “product-led sales” approach is proving to be a winning strategy.
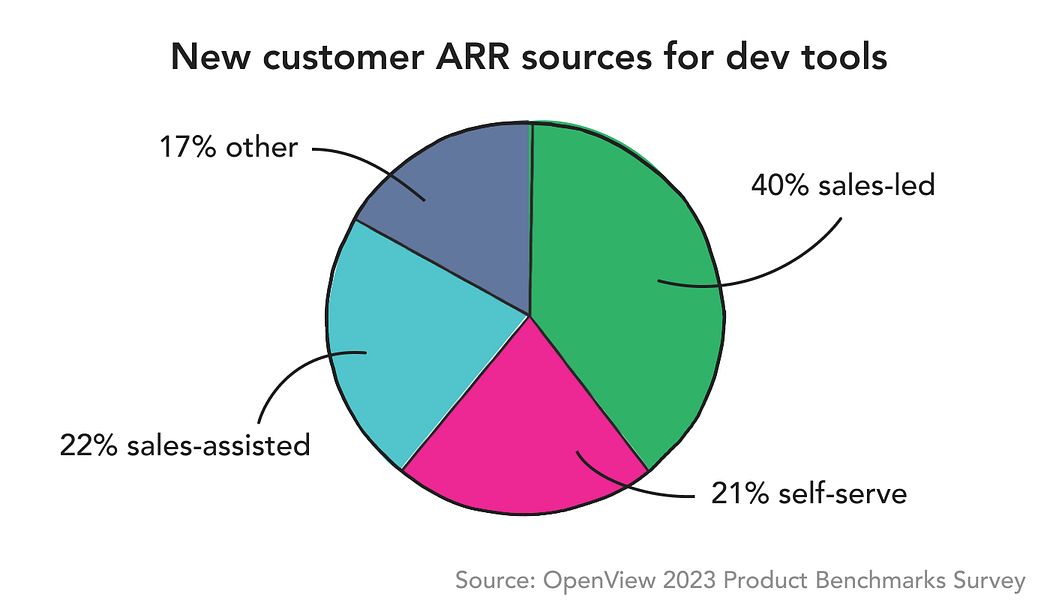
40% of new customer ARR comes from Sales
This year, dev tool companies reported that 40% of their new customer ARR is sales-led. 21% of new ARR is from self-serve, and 22% is sales-assisted. The rest came from partner channels and other sources.
If we drill specifically into sales-led companies, 56% of their new annual revenue came directly from sales. While we would expect product-led companies to have a lower percentage of revenue coming from the sales team, it still made up a significant chunk. 36% of the revenue of these companies was from self-serve, but 31% sales-assisted and 21% sales-led. This implies that a mixture of strategies is serving companies well.
What I’ve learnt from this data
The thing that stands out to me most is that the “product-led sales” approach is helping companies grow faster. In this year’s report, OpenView point out the best product-led growth companies seem to be using a bunch of different signals (such as level of product adoption, user role, and customer profile) to determine which users sales should to reach out to. PLG is the most popular method for developer tools, but it’s clear that in most cases, this needs to be paired with some form of sales motion to get a meaningful number of users converting.
So treat your self-serve sign ups as your most valuable lead source, and ensure you’re collecting the right data that Sales can use to help supercharge your product-led motion.
Ed Sim refers to a successful pairing of product and sales as the “sandwich model”, where a bottoms up motion is complemented with a top-down one. This ensures there’s not an over-reliance on one or the other, and I’ve found this also leads to a more well-rounded product that can stretch to the needs of both small and large teams.
What I’ve observed over the years is that no matter how you build and start your GTM motion, developer first, product led growth (PLG), or top down, every company eventually becomes an enterprise software company selling to large institutions…
This is the the 🥪 model in action where you build for a bottoms up user, grow the funnel and sprinkle in a few top down design partners in the early days.
Help! My numbers don’t look anything like this
The data I got is a segment of the full report, focusing just on the companies that reported their product was aimed at developers, or having developers listed as one of their main buyers.
All the data collected in the survey was self-reported. Each company measures their product performance metrics differently, if at all. Of those that do, some might not be measuring it accurately or excluding their own usage. In fact, I found some of the metrics responders submitted quite dubious! But there were enough responses that I’m still pretty confident in the overall benchmarks.
Every product is different. Being below the benchmark isn’t always a bad thing, as there are so many factors that inform it. Being well above it also doesn’t necessarily correspond to success. What’s important is that you’re getting conversion that validates your product market fit, and that you ultimately need to reach your ARR goals.
The performance metrics that OpenView chose are typical of what most companies measure, but not all will have this data to hand. Beyond making inferences based on the reported ARR, we don’t know the number of data points each reported metric contains. As such, some percentages could be based on only a couple of customers. For example, some responders reported 100% retention over 28 days, which seems implausible, but could be the case if they only have one or two users.
Why these metrics matter
These metrics are important to track. Something that surprised me when reviewing the data was the number of companies that didn’t report any metrics. There might be a good reason for this — the person completing the survey might not be in a role where they’d have this data easily to hand. They might not be comfortable sharing it. They might measure it, but in a different way. However, I’d guess that many don’t actively track it — or if they do, they don’t trust it. These particular performance benchmarks are so important as they speak to the current and future health of the business.
Not only are these metrics useful for understanding where you are today, you can also use them in your financial forecasting to model how much new ARR you might be able to generate if you increase the number of leads, or improve your conversion to paid metric by a couple of percentage points.
If you haven’t already, grab a coffee and have a read of OpenView’s full report. It’s packed full of great insights! And if you’re eager to learn how you can improve each of these metrics, head on over to my post on Repair tips for leaky conversion funnels.